I love the internet. As a child of Generation X, I had to rely extensively on libraries and books for any research that I might want to do until fortuitously, the internet arrived and I was and still am able to find answers to all my questions of life, death and the universe, online. This has been a great thing, even though it has been accompanied by social media and our obsessive desire to leave none of our narcissistic tendencies overlooked.
The increase in our digital use during and post-pandemic has also meant that we have transferred many of our high carbon emitting activities to slightly lower ones. Using Zoom instead of our cars for meetings, flying less for conferences, reading our books online instead of contributing to forest depletion and excessive water use by reading paper backs, even sending emails instead of letters, all use less carbon.
What does a digital carbon footprint mean?
But even though there is less carbon being emitted when we surf the internet, post on social media and send emails, that is not to say that NO carbon is being emitted. From the manufacture, end-use and finally the end of the products life, all our electronic devices use energy in some form or the other. And this has an impact on Earth’s climate and environment, especially when the sources of energy are from fossil fuels. This impact is our digital carbon footprint. The extraction of material from the ground to make phones and laptops, furthercontributes to the degradation of ecosystems and the environment.
The digital carbon footprint is the amount of emissions released due to digital technology. Electricity is used to power our devices, and also to keep the internet running. Buildings are required to house the hardware, data from computer networks, cloud services and digital applications – all of which need energy. The IT sector already uses an estimated 7% of global electricity according to Greenpeace and this is projected to increase to 20% of all electricity produced in the future.
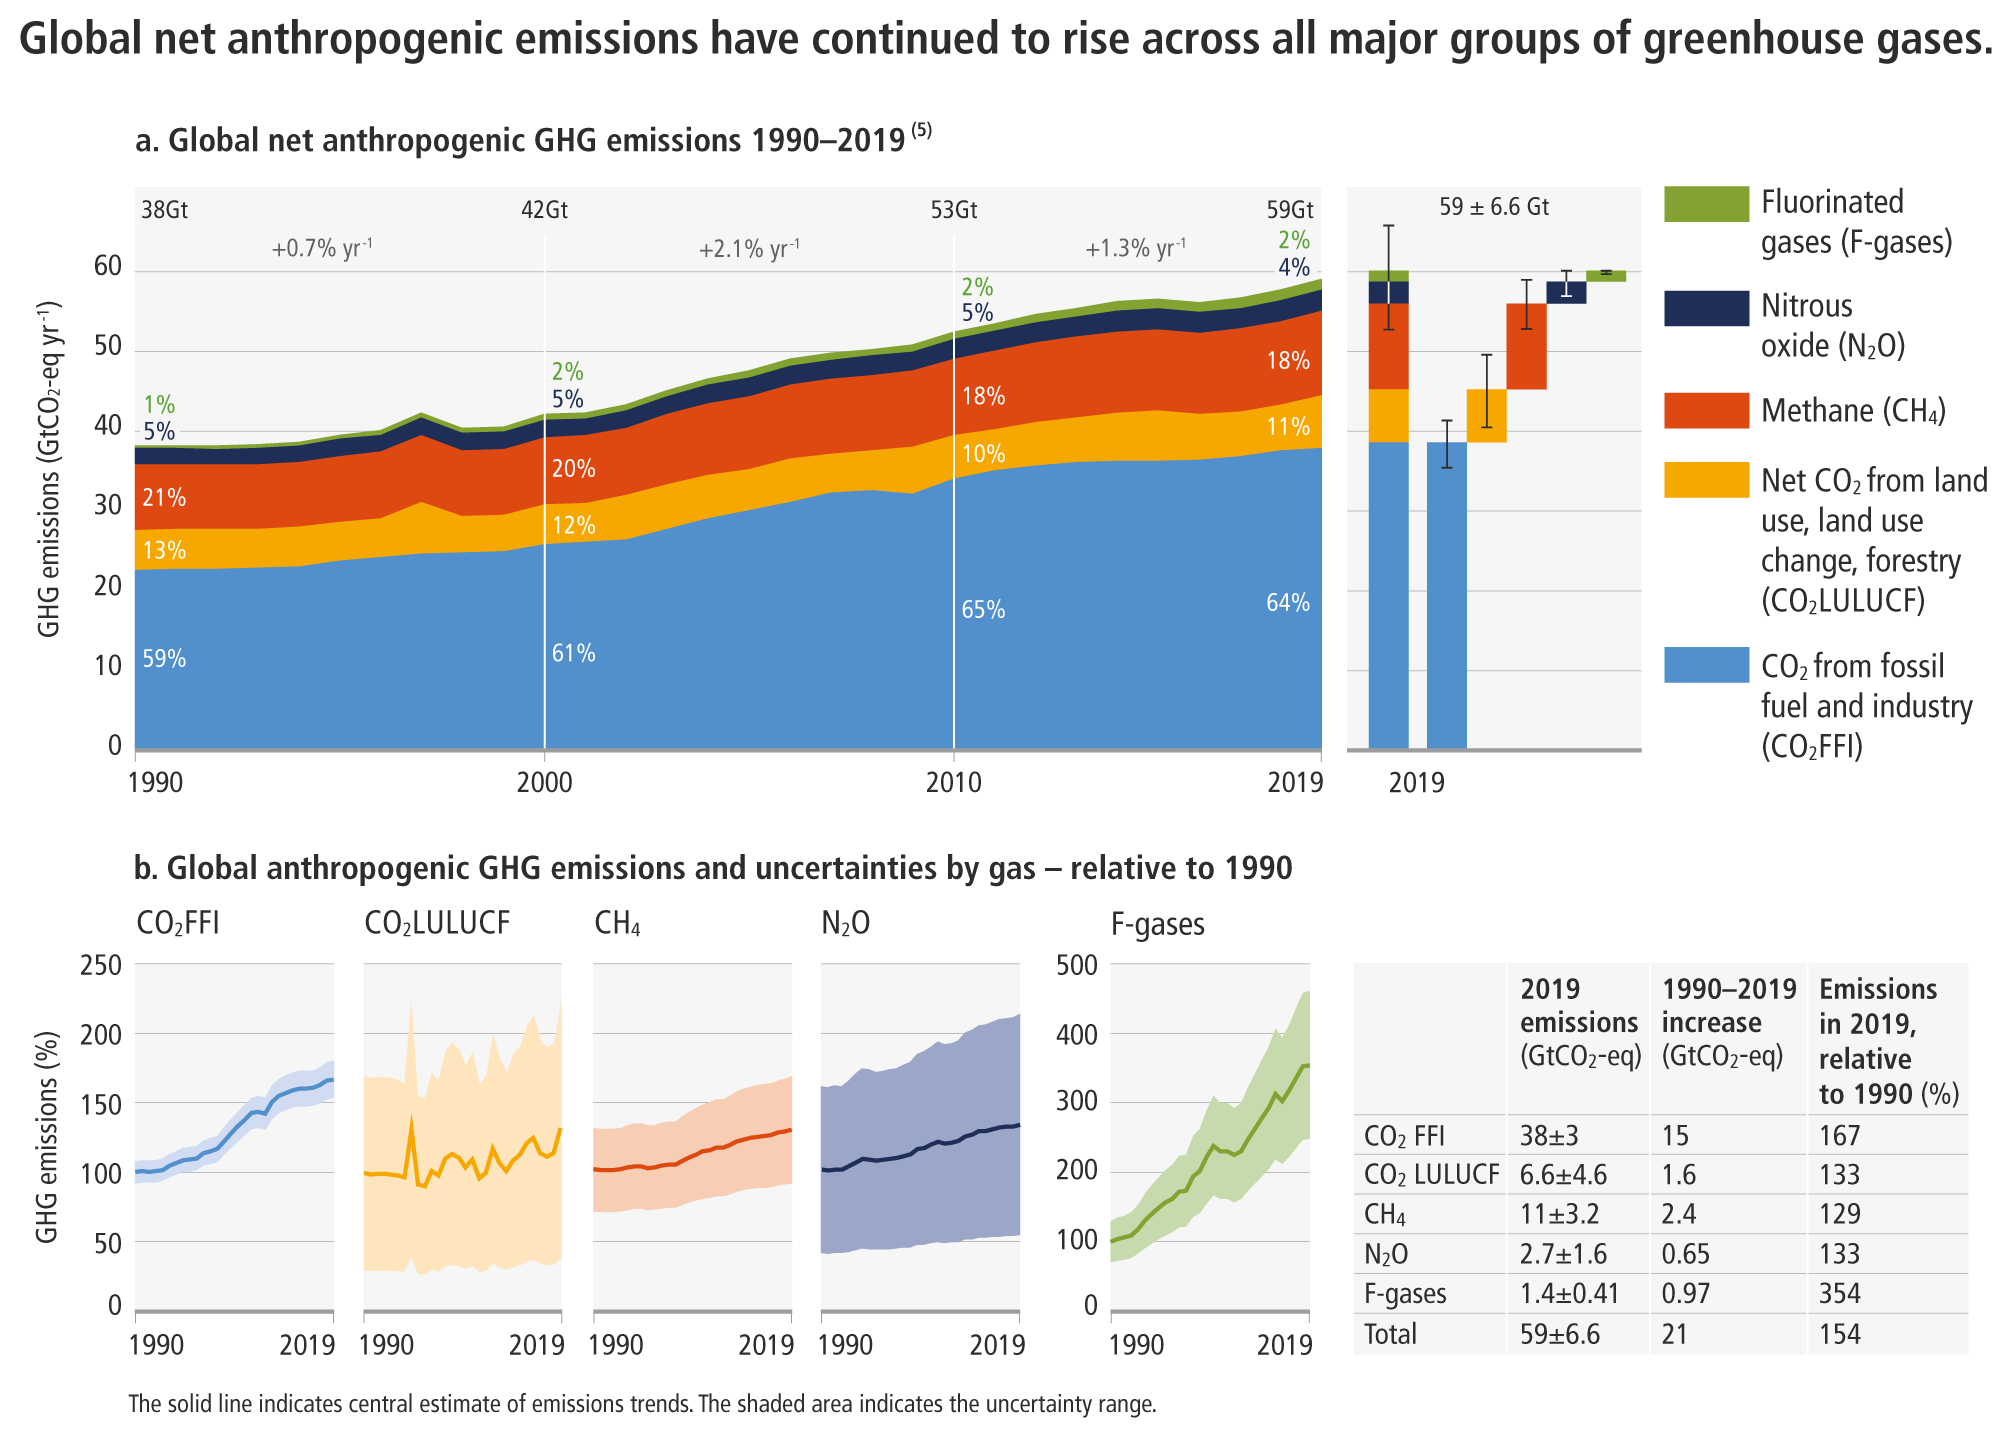
Digital technologies now contribute 5.5% of the world’s carbon emissions, likely to double by 2025. According to the Shift Project digital energy consumption rises by around 9% every year.
Then there is the impact of your own website, which, while not as humungous as other sources of carbon emissions, is still something to consider. Especially, as more and more of us spend more time on the internet for business and pleasure. Not only this, our collective thank your emails are adding to climate change by 16,433 tonnes of carbon a year! These are the emails you send when you just want to say thank you in response to another email.
How do we produce the digital carbon footprint?
Resource Mining
We need metals and mineral to manufacture our digital devices, and fibre optics cables. We have already started hearing about the environmental impact and carbon footprint of lithium, cobalt, nickel, manganese and graphite; metals used to power batteries used in electric vehicles, and out digital instruments. There is also resource mining to make new fibre optics cable that are needed to connect us digitally. Extraction of these materials is not only harmful to ecosystems and biodiversity, it also contributes to climate change.
Device manufacture
It all starts with the manufacturing process – for our digital instruments and the cables we use – during which a lot of carbon is emitted. Even now, as we move towards using renewable energy, we have still not completely given up on using hydrocarbons. Till we do that the manufacturing processes of our digital devices will continue to contribute to climate change.
Data Centers, Cloud Storage and Consumer Data Analytics
The we have the buildings for the huge data centres we need to house servers for websites and cloud storage, all of which use a prodigious amount of energy. Data centres process, store, and communicate all of the data behind the digital services we use, from social media to scientific computing. According to certain estimates, the existing 500,000 or so data centres alone consume 1% of global energy demand. Over 400 of these data centres are hyperscale, often the size of villages, such as those used by Amazon, Apple, Google and Microsoft. Furthermore, global cloud computing and storage is becoming more and more popular, and according to Greenpeace, uses more energy than all of Germany.
With more and more businesses finding a home online, and most of us buying and selling from our digital devices, a consumer data analytics industry has burgeoned. This is the process of collecting and analyzing consumer data for advertising and even law enforcement surveillance that requires a large number of actors including companies, government agencies, data brokers, and people-searchers.
Companies like Facebook or Google, that allow you to use their websites for free are not actually free. They track your activities and use this to send you targeted advertisements. Others may actually sell your online activity or data to other advertisers. Such “ad-tracking” uses a lare amount of energy through the tools that are used, as well as for data storage.
Undersea Fibre optics
To connect the world digitally, requires a global network of undersea cables and currently we have 1.4 milliom kilometres of undersea cables according to TeleGeography, contributing to over 90% of digital communication and commerce. They require resources to be mined for their manufacture, and furthermore, they disturb ocean ecosystems as they are laid across the seabed. This adds up to the digital carbon footprint and environmental degradation.
Cryptocurrency
Cryptocurrency, such as bitcoin and Ethereum, is the latest buzzword that many of us know without understanding what it really is. The proof of work required for cryptocurrency and the associated “mining” consume a large amount of energy. There are different estimations of how much energy the blockchain and mining cryptocurrency uses; some of them equating to energy consumption of a nation.
Internet and Device Users
And finally, there is us. Our use of computers, tablets and phones to access the internet all requires energy consumption (and this indirectly contributes to carbon emissions). According to Statista: “As of January 2023, there were 5.16 billion internet users worldwide, which is 64.4 percent of the global population. Of this total, 4.76 billion, or 59.4 percent of the world’s population, were social media users.”
Users account for 55% of the IT industry’s carbon footprint, while the manufacturing process accounts for the remaining 45%, according to Safetydetectives.
We upload and stream videos online, which uses more energy than any other online activity. Video accounts for 60% of the world’s internet traffic, while streaming produces 300 million metric tons of CO2 each year. In fact just Netflix accounts for 15% of global internet traffic, using 451,000 megawatt-hours of energy per year! Social media videos (such as on TikTok) and YouTube videos also account for 15% video streaming traffic together. In fact, video accounted for 66% of total internet volume in 2022.
Which companies have the largest footprint?
According to estimates by Safetydetectives, the companies with the largest digital carbon footprints are the usual suspects:
- Amazon produces 159 billion g/159,000 MT of global carbon dioxide equivalent (CO2e) daily,
- Netflix produces 60 billion g/60,000 MT of CO2e daily,
- Twitter produces 100 million g of CO2e daily,
- Google produces 700 million g of CO2e daily (although the company has been carbon neutral since 2007),
- Facebook produces 1.3 billion g of CO2e daily,
- YouTube produces 6 billion g of CO2e daily.
How to reduce our digital carbon footprint?
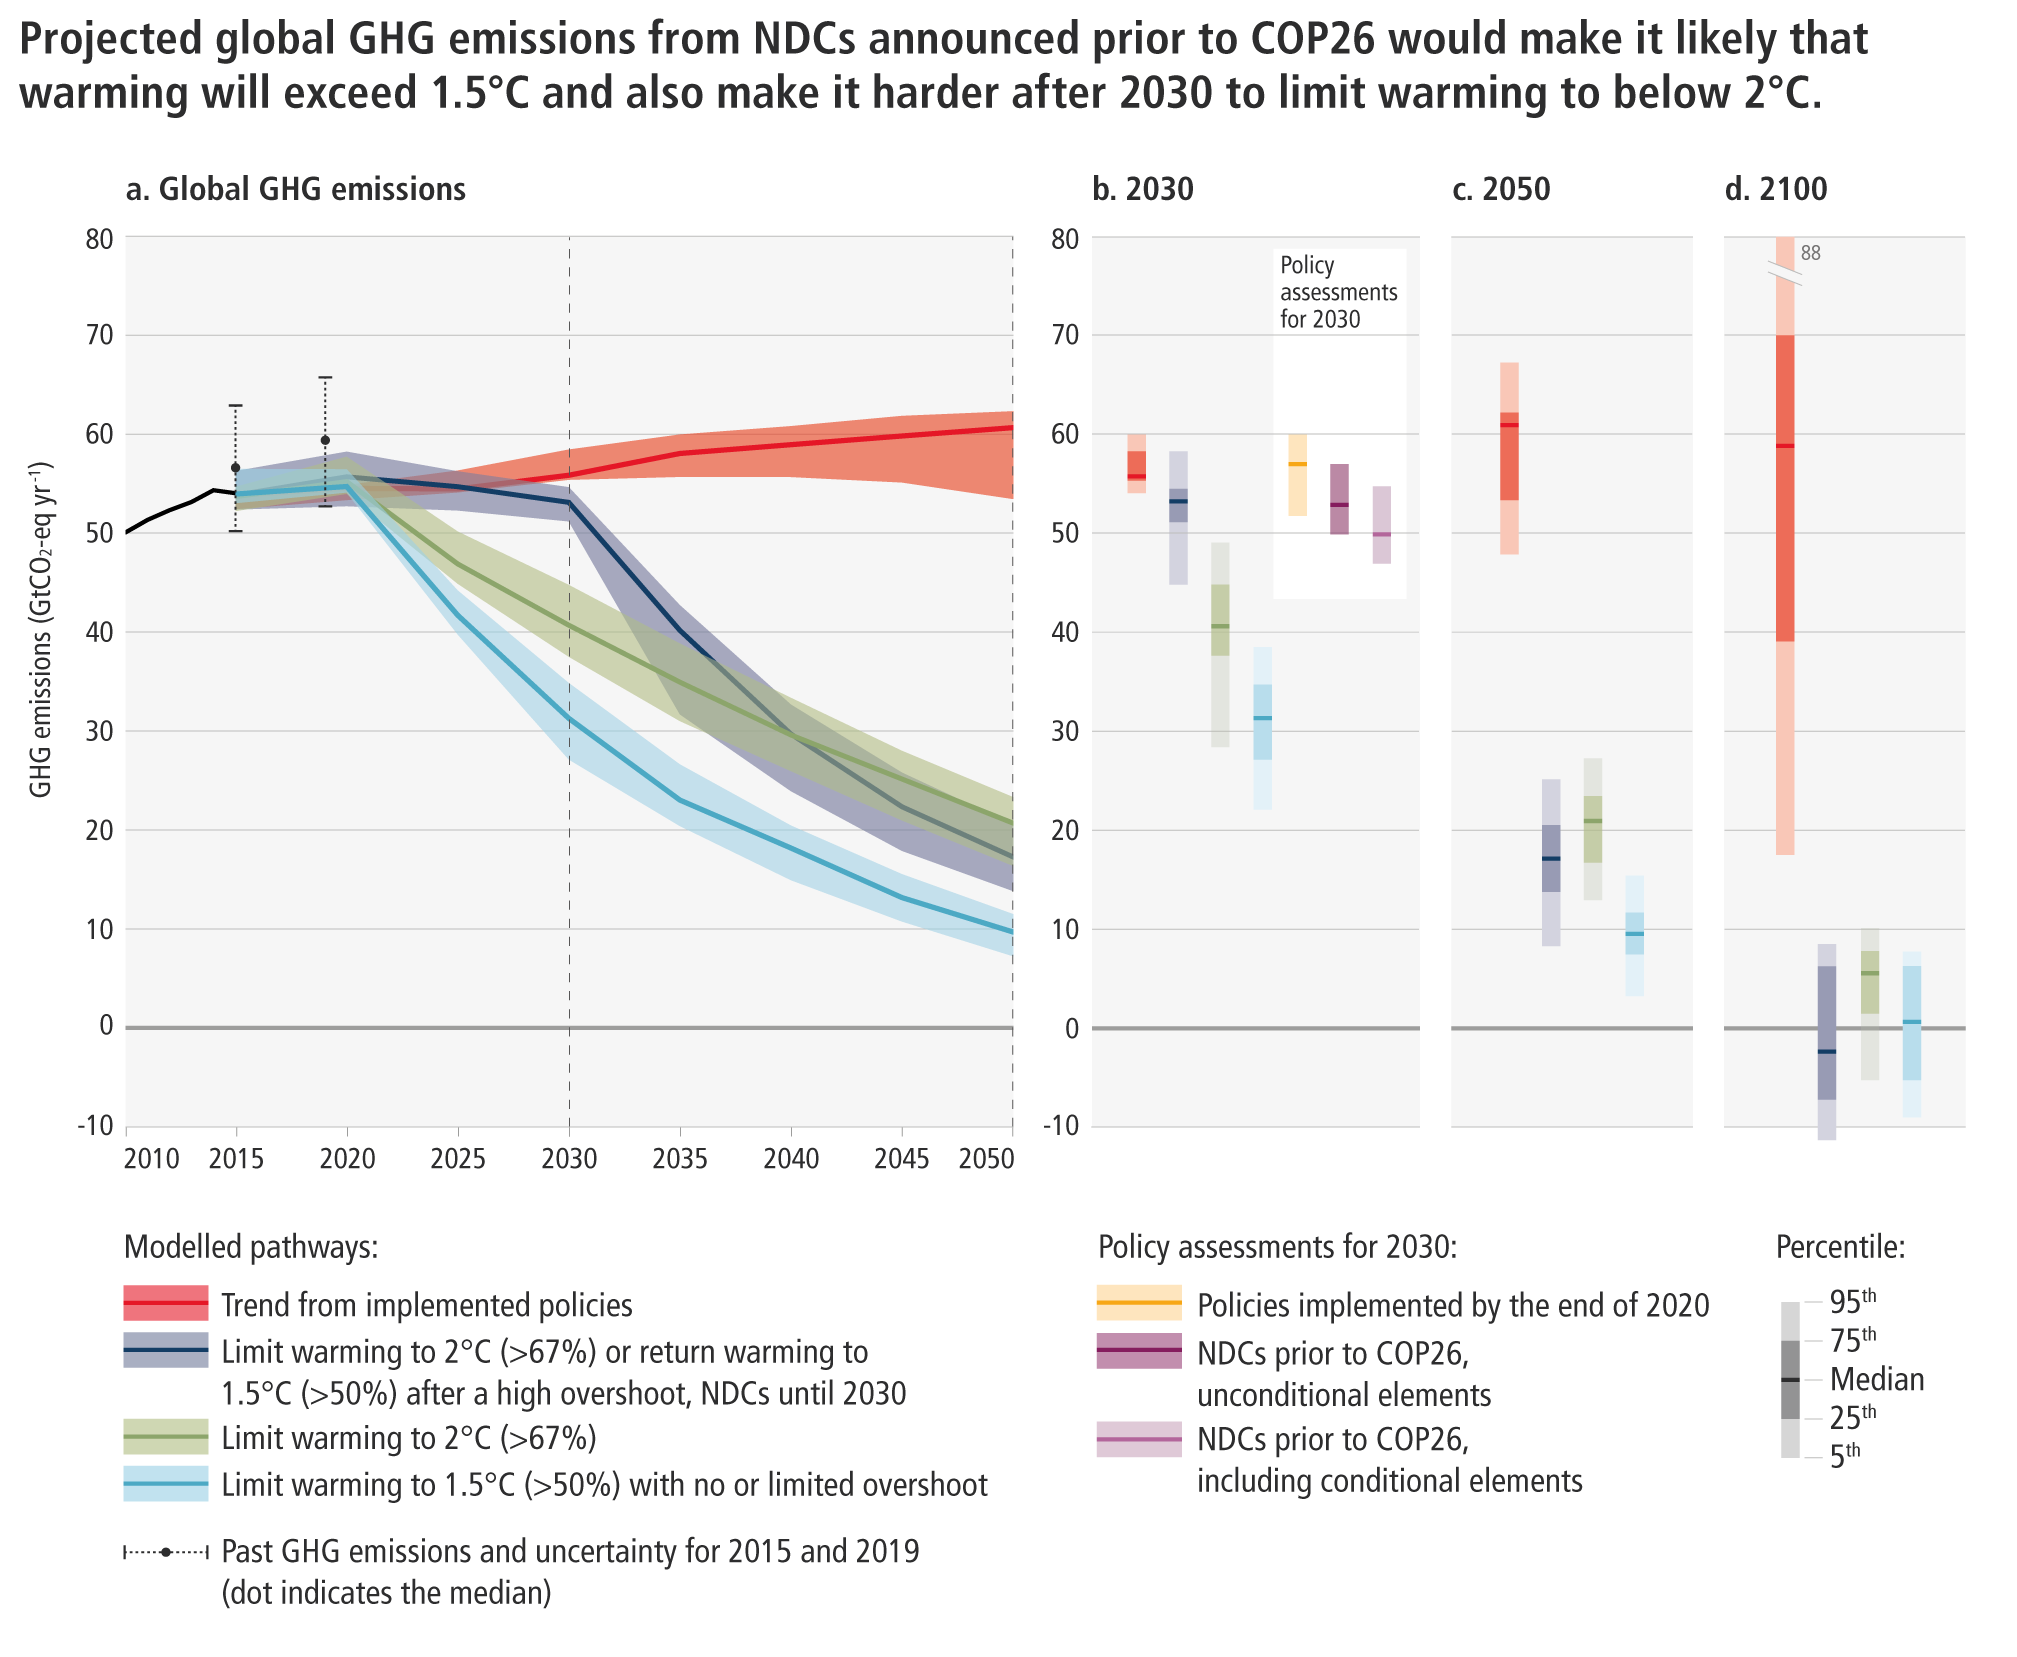
Many of these big online companies have committed to the Net Zero goal, formulated as part of the UN 2015 agreement on climate, known as the Paris Agreement. This Agreement aims to reach global carbon neutrality by 2050, which would require reducing our dependence on fossil fuels such as coal, oil and gas, as well as removing already emitted carbon from the atmosphere.
To achieve this the biggest digital companies have pledged to the Net Zero goal and taken steps to achieve it:
- Google has been carbon neutral since 2007;
- Apple uses 100% renewable energy and has committed to reach Net Zero for its supply chain and products by 2030;
- Microsoft has pledged to be carbon negative by 2030 and offset historical carbon emissions by 2050;
- Amazon has a goal of reaching Net Zero by 2040 and wants to use 100% renewable energy by 2025, it has also pledged to buy more electric delivery vehicles;
- Facebook aims to reach Net Zero by 2030; and
- Netflix also aims to reduce emissions by 45% by 2030 and had the aim to reach Net Zero by 2022 (not clear if this happened). It also aims to invest in regenerating natural ecosystems.
Furthermore, almost 1,400 individuals and companies (including Google) have signed the Sustainable Web Manifesto since 2019, committing themselves to create a greener and sustainable internet.
What can you do?
Decreasing electricity use and using renewable energy is step one. Everything we do when using the internet, from social media, music, emails, video streaming and even ecommerce use electricity, which is not always renewable.
So, first of all we should decrease how much we are online and decrease how much we use the web. According to Website Carbon the average website produces 1.76g of CO2e per page view, which means that a site with 50,000 page views per month emits 1,056kg of CO2e annually. This is just the average. The more complex a website is, the more energy it needs to function. Website Carbon also tells us that each time you visit google.com, 0.09 g of CO2e is released into the atmosphere. This is admittedly a lot less than many of our other activities, but as more and more users are added to the global digital community, it will add up. In the end it is not a bad idea to curtail how much time we spend online – not only is it good for the planet but also for our mental health.
Another step we can take is to switch over to a more climate friendly energy supplier. This however is easier to do in developed countries – developing country citizens do not have a lot of choice in energy suppliers.
For your own website, use a hosting company that uses green energy. Many are moving in this direction and there are more choices out there.
There are also ways to make the webpage lighter because your website also contributes to climate change. Images are perhaps the largest contributors to the weight of the website, so moving from JPEG and PNG to lighter formats such as SVG is one way of decreasing that size. Optimizing tools are also available that help you to reduce your image size and other aspects of the website – and many of these are free.
Make your video streaming climate friendly: shut off open tabs, turn off auto play, avoid using video when you can do with audio. Decreasing video streaming is also important, as video streaming uses prodigious amounts of energy. In fact, 80% of all data that is transferred through the internet is video data.
Power down your computer when away for longer periods instead of leaving it in sleep mode.
Close your browser when it is not being used, reduce the number of open tabs, and use bookmarks to jump directly to your desired page.
Dim your monitor: If possible, from 100% to 70% and use dark mode whenever you can.
Be conscious of vampire power: Plugged in but powered down devices/ devices on standby mode, which consume ¼ of residential energy
Use a mobile for quick searches instead of your laptop because a smaller screen requires less electricity to power the display.
Change your email habits: Unsubscribe from unused newsletters, limit reply all, and refrain from sending unnecessary emails.
Turn of trackers and surveillance, use ad blockers and turn off location tracking if you do not need it.
We have established that cloud services use a lot of energy, so reduce the amount of data you have on the cloud by cleaning it up. It is also a good idea to invest in an external hard-drive for all of your back up data instead of the cloud. If you need to use the cloud use Google, which consumes only around 0.013% of global energy because Google data centers are very efficient and use 50% less energy than typical data centers.
Use WiFi instead of mobile data whenever possible because WiFi connections are more efficient and infact, mobile networks are twice as energy-intensive. This will save energy and your hard-earned cash.
Remove unused apps from your devices and download some of the increasing number of green apps that are being developed for all kinds of activities and services, such as green food apps, travel apps and recylcing apps.
Do not be in a hurry to change IT equipment and try to get equipment repaired instead of throwing it away.
-
- Global e-waste generation between 2010-2019 was 53.6MT and undocumented global e-waste is estimated to be 44.3MT. Only 17.4% of e-waste is collected and properly recycled. E-waste comprises 70% of our toxic waste because most of our e-waste is burned or sent to landfills. So, dispose of your devices properly. You can resell them, or even return them to the company you originally bought them from.
The internet is now part of our lives and there is no going back. Overall, our digital carbon footprint is much less than air travel and other activities like reading (physical books use a lot of energy and water). We need the internet for everything we do and thankfully it still consumes a lot less energy and contributes less to carbon emissions. We just need to keep in mind that it does use energy and as more and more of us start living our lives online and use the digital world for most things, energy use and emissions will only increase. We must keep this in mind and work towards ensuring that our digital carbon footprint is small.








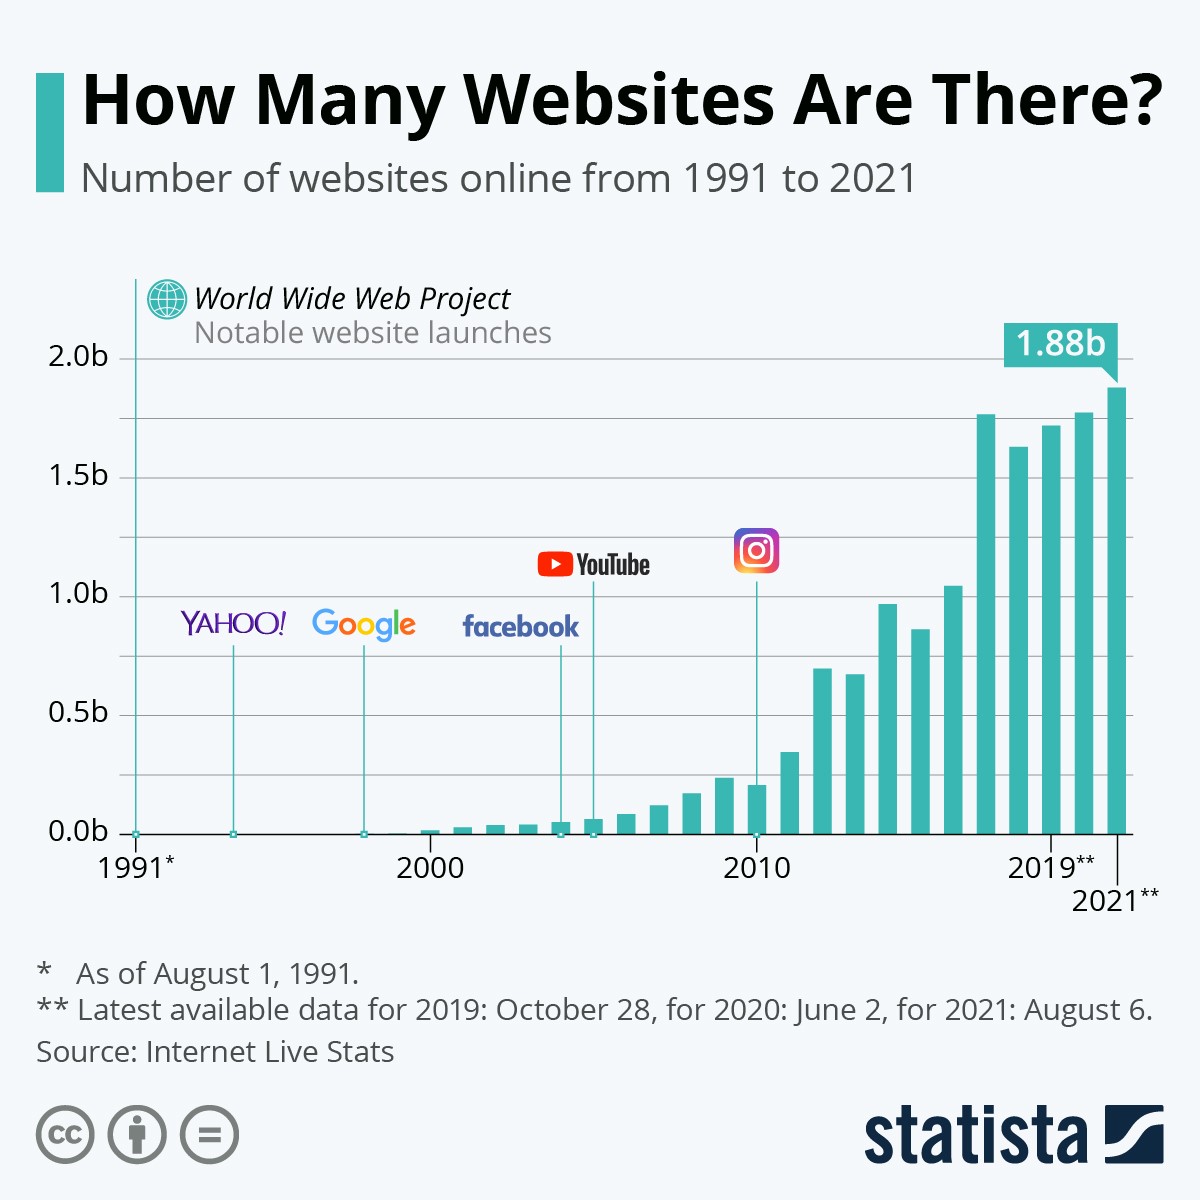 And our own websites produce carbon as well.

 Obviously, there are a multitude of ways to impact the climate through digital use, including direct carbon emission through manufacturing, use and disposal of technology. These are the ubiquitous gadgets we use but also mobile networks, enterprise networks and data centres. Manufacturing, shipping, powering, and cooling, all require huge amounts of energy.