Want to reduce your digital carbon footprint? Here’s how

I love the internet. As a child of Generation X, I had to rely extensively on libraries and books for any research that I might want to do until fortuitously, the internet arrived and I was and still am able to find answers to all my questions of life, death and the universe, online. This has been a great thing, even though it has been accompanied by social media and our obsessive desire to leave none of our narcissistic tendencies overlooked.

The increase in our digital use during and post-pandemic has also meant that we have transferred many of our high carbon emitting activities to slightly lower ones. Using Zoom instead of our cars for meetings, flying less for conferences, reading our books online instead of contributing to forest depletion and excessive water use by reading paper backs, even sending emails instead of letters, all use less carbon.

What does a digital carbon footprint mean?

But even though there is less carbon being emitted when we surf the internet, post on social media and send emails, that is not to say that NO carbon is being emitted. From the manufacture, end-use and finally the end of the products life, all our electronic devices use energy in some form or the other. And this has an impact on Earth’s climate and environment, especially when the sources of energy are from fossil fuels. This impact is our digital carbon footprint. The extraction of material from the ground to make phones and laptops, furthercontributes to the degradation of ecosystems and the environment.

The digital carbon footprint is the amount of emissions released due to digital technology. Electricity is used to power our devices, and also to keep the internet running. Buildings are required to house the hardware, data from computer networks, cloud services and digital applications – all of which need energy. The IT sector already uses an estimated 7% of global electricity according to Greenpeace and this is projected to increase to 20% of all electricity produced in the future.

Digital technologies now contribute 5.5% of the world’s carbon emissions, likely to double by 2025. According to the Shift Project digital energy consumption rises by around 9% every year.

Then there is the impact of your own website, which, while not as humungous as other sources of carbon emissions, is still something to consider. Especially, as more and more of us spend more time on the internet for business and pleasure. Not only this, our collective thank your emails are adding to climate change by 16,433 tonnes of carbon a year! These are the emails you send when you just want to say thank you in response to another email.

How do we produce the digital carbon footprint?

Resource Mining

We need metals and mineral to manufacture our digital devices, and fibre optics cables. We have already started hearing about the environmental impact and carbon footprint of lithium, cobalt, nickel, manganese and graphite; metals used to power batteries used in electric vehicles, and out digital instruments. There is also resource mining to make new fibre optics cable that are needed to connect us digitally. Extraction of these materials is not only harmful to ecosystems and biodiversity, it also contributes to climate change.

Device manufacture

It all starts with the manufacturing process – for our digital instruments and the cables we use – during which a lot of carbon is emitted. Even now, as we move towards using renewable energy, we have still not completely given up on using hydrocarbons. Till we do that the manufacturing processes of our digital devices will continue to contribute to climate change.

Data Centers, Cloud Storage and Consumer Data Analytics

The we have the buildings for the huge data centres we need to house servers for websites and cloud storage, all of which use a prodigious amount of energy. Data centres process, store, and communicate all of the data behind the digital services we use, from social media to scientific computing. According to certain estimates, the existing 500,000 or so data centres alone consume 1% of global energy demand. Over 400 of these data centres are hyperscale, often the size of villages, such as those used by Amazon, Apple, Google and Microsoft. Furthermore, global cloud computing and storage is becoming more and more popular, and according to Greenpeace, uses more energy than all of Germany.

With more and more businesses finding a home online, and most of us buying and selling from our digital devices, a consumer data analytics industry has burgeoned. This is the process of collecting and analyzing consumer data for advertising and even law enforcement surveillance that requires a large number of actors including companies, government agencies, data brokers, and people-searchers.

Companies like Facebook or Google, that allow you to use their websites for free are not actually free. They track your activities and use this to send you targeted advertisements. Others may actually sell your online activity or data to other advertisers. Such “ad-tracking” uses a lare amount of energy through the tools that are used, as well as for data storage.

Undersea Fibre optics

To connect the world digitally, requires a global network of undersea cables and currently we have 1.4 milliom kilometres of undersea cables according to TeleGeography, contributing to over 90% of digital communication and commerce. They require resources to be mined for their manufacture, and furthermore, they disturb ocean ecosystems as they are laid across the seabed. This adds up to the digital carbon footprint and environmental degradation.

Cryptocurrency

Cryptocurrency, such as bitcoin and Ethereum, is the latest buzzword that many of us know without understanding what it really is. The proof of work required for cryptocurrency and the associated “mining” consume a large amount of energy. There are different estimations of how much energy the blockchain and mining cryptocurrency uses; some of them equating to energy consumption of a nation.

Internet and Device Users

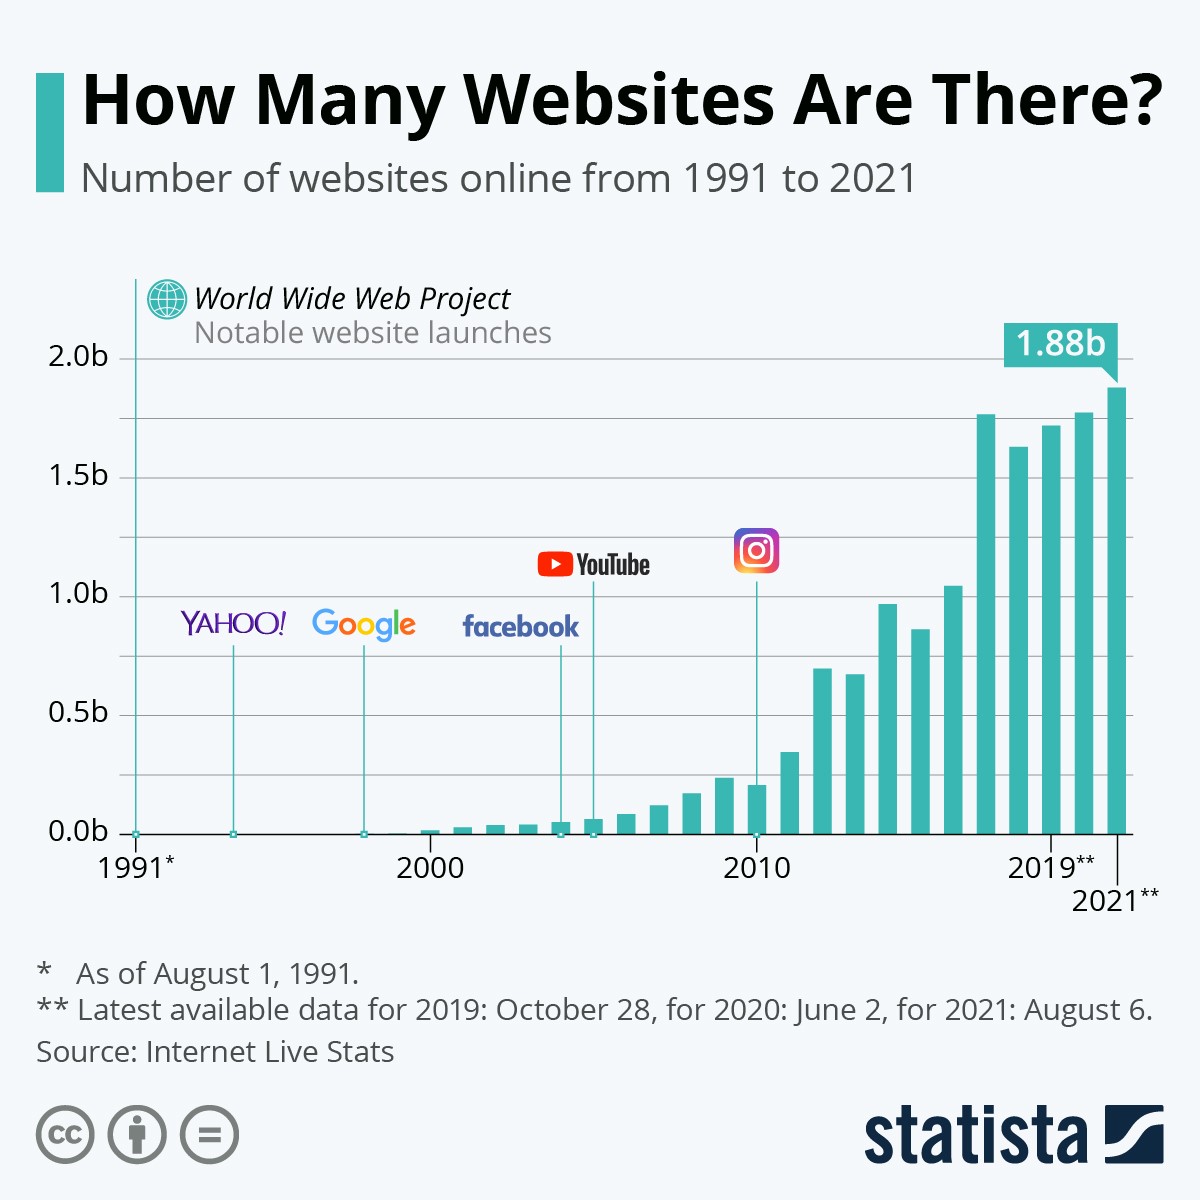
And finally, there is us. Our use of computers, tablets and phones to access the internet all requires energy consumption (and this indirectly contributes to carbon emissions). According to Statista:As of January 2023, there were 5.16 billion internet users worldwide, which is 64.4 percent of the global population. Of this total, 4.76 billion, or 59.4 percent of the world’s population, were social media users.

Users account for 55% of the IT industry’s carbon footprint, while the manufacturing process accounts for the remaining 45%, according to Safetydetectives.

We upload and stream videos online, which uses more energy than any other online activity. Video accounts for 60% of the world’s internet traffic, while streaming produces 300 million metric tons of CO2 each year. In fact just Netflix accounts for 15% of global internet traffic, using 451,000 megawatt-hours of energy per year! Social media videos (such as on TikTok) and YouTube videos also account for 15% video streaming traffic together. In fact, video accounted for 66% of total internet volume in 2022.

Which companies have the largest footprint?

According to estimates by Safetydetectives, the companies with the largest digital carbon footprints are the usual suspects:

  • Amazon produces 159 billion g/159,000 MT of global carbon dioxide equivalent (CO2e) daily,
  • Netflix produces 60 billion g/60,000 MT of CO2e daily,
  • Twitter produces 100 million g of CO2e daily,
  • Google produces 700 million g of CO2e daily (although the company has been carbon neutral since 2007),
  • Facebook produces 1.3 billion g of CO2e daily,
  • YouTube produces 6 billion g of CO2e daily.
How to reduce our digital carbon footprint?

Many of these big online companies have committed to the Net Zero goal, formulated as part of the UN 2015 agreement on climate, known as the Paris Agreement. This Agreement aims to reach global carbon neutrality by 2050, which would require reducing our dependence on fossil fuels such as coal, oil and gas, as well as removing already emitted carbon from the atmosphere.

To achieve this the biggest digital companies have pledged to the Net Zero goal and taken steps to achieve it:

  • Google has been carbon neutral since 2007;
  • Apple uses 100% renewable energy and has committed to reach Net Zero for its supply chain and products by 2030;
  • Microsoft has pledged to be carbon negative by 2030 and offset historical carbon emissions by 2050;
  • Amazon has a goal of reaching Net Zero by 2040 and wants to use 100% renewable energy by 2025, it has also pledged to buy more electric delivery vehicles;
  • Facebook aims to reach Net Zero by 2030; and
  • Netflix also aims to reduce emissions by 45% by 2030 and had the aim to reach Net Zero by 2022 (not clear if this happened). It also aims to invest in regenerating natural ecosystems.

Furthermore, almost 1,400 individuals and companies (including Google) have signed the Sustainable Web Manifesto since 2019, committing themselves to create a greener and sustainable internet.

What can you do?

Decreasing electricity use and using renewable energy is step one. Everything we do when using the internet, from social media, music, emails, video streaming and even ecommerce use electricity, which is not always renewable.

So, first of all we should decrease how much we are online and decrease how much we use the web. According to Website Carbon the average website produces 1.76g of CO2e per page view, which means that a site with 50,000 page views per month emits 1,056kg of CO2e annually. This is just the average. The more complex a website is, the more energy it needs to function. Website Carbon also tells us that each time you visit google.com, 0.09 g of CO2e is released into the atmosphere. This is admittedly a lot less than many of our other activities, but as more and more users are added to the global digital community, it will add up. In the end it is not a bad idea to curtail how much time we spend online – not only is it good for the planet but also for our mental health.

Another step we can take is to switch over to a more climate friendly energy supplier. This however is easier to do in developed countries – developing country citizens do not have a lot of choice in energy suppliers.

For your own website, use a hosting company that uses green energy. Many are moving in this direction and there are more choices out there.

There are also ways to make the webpage lighter because your website also contributes to climate change. Images are perhaps the largest contributors to the weight of the website, so moving from JPEG and PNG to lighter formats such as SVG is one way of decreasing that size. Optimizing tools are also available that help you to reduce your image size and other aspects of the website – and many of these are free.

Make your video streaming climate friendly: shut off open tabs, turn off auto play, avoid using video when you can do with audio. Decreasing video streaming is also important, as video streaming uses prodigious amounts of energy. In fact, 80% of all data that is transferred through the internet is video data.

Power down your computer when away for longer periods instead of leaving it in sleep mode.

Close your browser when it is not being used, reduce the number of open tabs, and use bookmarks to jump directly to your desired page.

Dim your monitor: If possible, from 100% to 70% and use dark mode whenever you can.

Be conscious of vampire power: Plugged in but powered down devices/ devices on standby mode, which consume ¼ of residential      energy

Use a mobile for quick searches instead of your laptop because a smaller screen requires less electricity to power the display.

Change your email habits: Unsubscribe from unused newsletters, limit reply all, and refrain from sending unnecessary emails.

Turn of trackers and surveillance, use ad blockers and turn off location tracking if you do not need it.

We have established that cloud services use a lot of energy, so reduce the amount of data you have on the cloud by cleaning it up. It is also a good idea to invest in an external hard-drive for all of your back up data instead of the cloud. If you need to use the cloud use Google, which consumes only around 0.013% of global energy because Google data centers are very efficient and use 50% less energy than typical data centers.

Use WiFi instead of mobile data whenever possible because WiFi connections are more efficient and infact, mobile networks are twice as energy-intensive. This will save energy and your hard-earned cash.

Remove unused apps from your devices and download some of the increasing number of green apps that are being developed for all kinds of activities and services, such as green food apps, travel apps and recylcing apps.

Do not be in a hurry to change IT equipment and try to get equipment repaired instead of throwing it away.

The internet is now part of our lives and there is no going back. Overall, our digital carbon footprint is much less than air travel and other activities like reading (physical books use a lot of energy and water). We need the internet for everything we do and thankfully it still consumes a lot less energy and contributes less to carbon emissions. We just need to keep in mind that it does use energy and as more and more of us start living our lives online and use the digital world for most things, energy use and emissions will only increase. We must keep this in mind and work towards ensuring that our digital carbon footprint is small.

What the IPCC’s latest climate change report says in – figures

What does the latest UN climate change report, published by the Intergovermental Panel on Climate Change (IPCC) on Monday April 5, 2022, say? The detailed report has been summarised by the IPCC into figures that give a clear snapshot of where are, where we want to going and how we can get there.

In April 2021, the warming had already reached 419.28 parts per million (ppm). On May 5, 2022 it was 419.68 ppm according to co2.earth.

While anthropogenic emissions are still increasing  (we had already reached 1.2C in April 2021 from pre- industrial time and warming has increases 1.1C since 1850 and 1900), their growth rate was slower between 2010 and 2019 than between 2000 and 2009. However, in order to limit climate change to 1.5C above pre-industrial levels (as agreed in the Paris Agreement), greenhouse gas emissions need to reach their highest peak before 2025. And by 2030, greenhouse gas emissions must be reduced by 43%, according to the report. Unfortunately, that is not where we are headed currently. In fact, according to United Nations Secretary General António Guterres “Current climate pledges would mean a 14% increase in emissions, and most major emitters are not taking the steps needed to fulfill even these inadequate promises.”

Chart depicting greenhouse gas emissions. IPCC 2022
Anthropogenic emissions greenhouse gas emissions over the last few decades. Source: Intergovernmental Panel on Climate Change (IPCC)


Emissions have increased in every region but are distributed unevenly both in present day and as cummulative emissions since 1850s, highlighted in the chart below. They have mostly come from developed countries as a result of unsustainable energy and land use. The least developed and developing countries are the lowest contributers to climate change but they will be impacted the most, especially island nations that are already starting to face sea level rise.

“Climate change is the result of more than a century of unsustainable energy and land use, lifestyles and patterns of consumption and production,” said IPCC Working Group III Co-Chair Jim Skea in a written statement published with the report. “This report shows how taking action now can move us towards a fairer, more sustainable world.”

Regional green house gas emissions. Courtesy Intergovernmental Panel on Climate Change (IPCC)
Regional green house gas emissions. Source: Intergovernmental Panel on Climate Change (IPCC)


There is some good news. The cost of renewable energy sources such as wind and solar have progressively dropped due to increased efforts in new development and scaling up. Renewables are already far cheaper than other sources, as the chart below indicates – cost of solar energy has decreased by about 85% and wind has reduced by 50% over the last decade.


Cost of renewable energy sources and adoption. Courtesy Intergovernmental Panel on Climate Change (IPCC)
Cost of renewable energy sources and their adoption. Source: Intergovernmental Panel on Climate Change (IPCC)


However, current climate action is still insufficient and projected global GHG emissions from countries’ Nationally Determined Contributions (NDCs) announced prior to COP 26 would make it likely that warming will exceed 1.5C, and furthermore, make it harder to limit it to below 2C after 2030, as indicated in the chart below.


Projected greenhouse gas emissions for various policy approaches. Courtesy Intergovernmental Panel on Climate Change (IPCC)
Projected greenhouse gas emissions for various policy approaches. Source: Intergovernmental Panel on Climate Change (IPCC)


Different scenarios show that more aggressive actions need to be undertaken to decrease warming as can be seen in the chart below, which indicates 8 response scenarios. The light blue (C1) is the most aggressive and will result in the least warming, while the red (C8) is less aggressive and will lead to more warming.

Projected global mean warming of 8 response scenarios. Courtesy Intergovernmental Panel on Climate Change (IPCC)
Projected global mean warming of 8 response scenarios. Source: Intergovernmental Panel on Climate Change (IPCC)


Mitigation pathways that limit global warming to 1.5 or 2 degrees Celsius will require immediate action. The chart below shows modelled pathways that limit warming to 1.5C and 2C. This would need deep, rapid and sustained emission reductions.
The chart shows greenhouse gas (GHG), carbon dioxide (CO2) methane (CH4) and nitrous oxide (N2O) emissions under various scenarios. The IPCC calls these illustrative mitigation emissions pathways (IMPs), where the red shows the pathway if current policies are continued, while the blue indicates pathways if more aggressive policies that limit global warming to 1.5°C are implemented.
“We are at a crossroads. The decisions we make now can secure a liveable future. We have the tools and know-how required to limit warming,” said IPCC Chair Hoesung Lee.  “I am encouraged by climate action being taken in many countries. There are policies, regulations and market instruments that are proving effective.  If these are scaled up and applied more widely and equitably, they can support deep emissions reductions and stimulate innovation.”
“It’s now or never, if we want to limit global warming to 1.5°C (2.7°F),” Co-Chair Jim Skea added. “Without immediate and deep emissions reductions across all sectors, it will be impossible.”


Mitigation pathways that limit global warming to 1.5 or 2 degrees Celsius will require immediate action. Courtesy Intergovernmental Panel on Climate Change (IPCC)
Mitigation pathways that limit global warming to 1.5 or 2 degrees Celsius will require immediate action. Source: Intergovernmental Panel on Climate Change (IPCC)


The following chart shows the sectors where emissions come from, with mitigation pathways that can get us to net zero.

According to the press release, “Limiting global warming will require major transitions in the energy sector. This will involve a substantial reduction in fossil fuel use, widespread electrification, improved energy efficiency, and use of alternative fuels (such as hydrogen). Cities and other urban areas also offer significant opportunities for emissions reductions.  These can be achieved through lower energy consumption (such as by creating compact, walkable cities), electrification of transport in combination with low-emission energy sources, and enhanced carbon uptake and storage using nature. There are options for established, rapidly growing and new cities.”

“Reducing emissions in industry will involve using materials more efficiently, reusing and recycling products and minimising waste. For basic materials, including steel, building materials and chemicals, low- to zero-greenhouse gas production processes are at their pilot to near-commercial stage. This sector accounts for about a quarter of global emissions. Achieving net zero will be challenging and will require new production processes, low and zero emissions electricity, hydrogen, and, where necessary, carbon capture and storage. Agriculture, forestry, and other land use can provide large-scale emissions reductions and also remove and store carbon dioxide at scale. However, land cannot compensate for delayed emissions reductions in other sectors. Response options can benefit biodiversity, help us adapt to climate change, and secure livelihoods, food and water, and wood supplies,” the press release adds.

“The global temperature will stabilise when carbon dioxide emissions reach net zero. For 1.5°C (2.7°F), this means achieving net zero carbon dioxide emissions globally in the early 2050s; for 2°C (3.6°F), it is in the early 2070s,” concludes the press release.


Contributions of carbon dioxide by sector for several mitigation strategies, some of which include direct air carbon capture. Courtesy Intergovernmental Panel on Climate Change (IPCC)
Contributions of carbon dioxide by sector for several mitigation strategies, some of which include direct air carbon capture. Source: Intergovernmental Panel on Climate Change (IPCC)


The chart below provides an overview of mitigation options and technologies, as well as their estimated ranges of costs and potential in 2030. There are many options available now in all sectors that help reduce net emissions. There are also synergies and trade-offs between sectoral and system mitigation options and the UN’s 17 Sustainable Development Goals.

According to the written statement,”Accelerated and equitable climate action in mitigating and adapting to climate change impacts is critical to sustainable development. Some response options can absorb and store carbon and, at the same time, help communities limit the impacts associated with climate change. For example, in cities, networks of parks and open spaces, wetlands and urban agriculture can reduce flood risk and reduce heat-island effects. Mitigation in industry can reduce environmental impacts and increase employment and business opportunities. Electrification with renewables and shifts in public transport can enhance health, employment, and equity”.


Overview of climate mitigation options and their estimated ranges of costs and potentials in 2030 Courtesy Intergovernmental Panel on Climate Change (IPCC)
Overview of climate mitigation options and their estimated ranges of costs and potentials in 2030. Source: Intergovernmental Panel on Climate Change (IPCC)


Synergies and trade-offs between mitigation options and Sustainable Development Goals. Credit: IPCC 2022
Synergies and trade-offs between mitigation options and Sustainable Development Goals. Source: Intergovernmental Panel on Climate Change (IPCC)


What can we, the people, do? Ultimately, our actions can lower demand for energy intensive, carbon emitting technologies and products. Demand-side mitigation has huge potential and can be achieved through changes in three main areas: socio-cultural factors, infrastructure design and use, and end-use technology adoption by 2050.

“Having the right policies, infrastructure and technology in place to enable changes to our lifestyles and behavior can result in a 40-70% reduction in greenhouse gas emissions by 2050. This offers significant untapped potential,” said IPCC Working Group III Co-Chair Priyadarshi Shukla, in the written statement. “The evidence also shows that these lifestyle changes can improve our health and wellbeing.”

Buildings will need to become more efficient. “We see examples of zero energy or zero-carbon buildings in almost all climates,” said Skea. “Action in this decade is critical to capture the mitigation potential of buildings.”

The potential impact to climate change mitigation impacts of changing the demand for food, electricity and manufactured products by infrastructure and behavioral adaptations. Courtesy Intergovernmental Panel on Climate Change (IPCC)
The potential impact to climate change mitigation impacts of changing the demand for food, electricity and manufactured products by infrastructure and behavioral adaptations. Source: Intergovernmental Panel on Climate Change (IPCC)

Your website is adding to climate change

Series: Digital Sustainability – Websites

What a long way we have come from those early websites that were hard coded by experts! Modern websites not only come with a host of options but most importantly, they can be easily constructed by anyone with a little bit of understanding about how the internet works.

And as we well and truly settle into the digital age, the website is going to be as ubiquitous as the corner-shop of the past. Except, now you can animate your products, show videos, and even sell online with a much lower cost than having a physical premises.

There is however another cost. That of the impact of your website on the climate, which, while not as humungous as other sources of carbon emissions, is still something to consider. Especially, as more and more of us spend more time on the internet for business and pleasure.

Our digital footprint is not just about the emails we send or the posts we make on social media. Buildings are required to house the hardware, data from computer networks, cloud services and digital applications – all of which also need energy. The IT sector already uses an estimated 7% of global electricity according to Greenpeace and this is projected to increase to 20% of all electricity produced, contributing 5.5% of the world’s carbon emissions.

And our own websites produce carbon as well. Median desktop page transfer size increased by 2165.5KB between 2015 and 2022 – an increase of 70%. Median mobile page transfer size increased by 1974KB during the same period – an increase of 127%.

Website Carbon tells us that each time you visit google.com, 0.09 g of CO2e is released into the atmosphere. Granted, this is not a lot. In fact, this is less than that emitted by the Greenpeace website. Both Google and Greenpeace are working towards using green energy. But that’s not the point here. Think of all the websites out there combined, with more coming up each day.

The first ever website was published 30 years ago, on August 6, 1991, by physicist Tim Berners-Lee at CERN in Switzerland. It was called the World Wide Web (W3). Today, it is estimated that 1.7 billion websites exist, (some sources say 1.88 billion see figure) but this number fluctuates, as new ones are launched, or others are closed. Even so, the world wide web is gigantic, and 4.5 billion people are now able to interact on the internet. Each day 576,000 new websites are created.

According to Website Carbon the average website produces 1.76g of CO2e per page view, which means that a site with 50,000 page views per month emits 1,056kg of CO2e annually. This is just the average. The more complex a website is, the more energy it needs to function. This means more carbon emissions, which are not just calculated by the size of a webpage but include the energy source used by the data centre, how much energy is used to transfer and process data, the efficiency of the user’s device, and how the webpage behaves as it loads. As we add on images and videos, webpages become heavier, less efficient and emit more carbon.

So, what can we do? The most important thing is to use a hosting company that uses green energy. Plus, move your own energy consumption to renewable energy as well.

There are also ways to make the webpage lighter. Images are perhaps the largest contributors to the weight of the website, so moving from JPEG and PNG to lighter formats such as SVG is one way of decreasing that size. Many optimizing tools are also available that help you to reduce your image size – and several of these are free.

Many companies that have finally ventured on the road to climate and environment consciousness are starting by making their websites as light as possible, with very few or no images, reduced use of colour and by streamlining the coding used. Some websites hark back to the original website created in 1991 with just a white background and text, producing only 0.39kg of CO2e per year. There are still very few climate-friendly websites, but as people get more and more involved in digital sustainability, there is likely to be a change.

To me it seems though that we need to come up with more innovative ways of decreasing our digital carbon footprint (Read Stop sending thank you emails), and we are not there yet. The trend of making websites completely bare is in itself an unsustainable trend. It won’t catch on and it won’t last. It is very well for Elon Musk and Volkswagon to have ONE of their websites as lighter versions using less electricity, but their other websites continue along the same lines. We need to come up with better and inventive ways of ensuring that our digital life does not have the same results as our fossil fuel consumption did.

Almost 1,400 individuals and companies (including Google) have signed the Sustainable Web Manifesto since 2019, committing themselves to create a greener and sustainable internet. But what does this really mean? Are we all going to start creating starkly bare websites? I am not so sure. What I do know is that as more and more people get access to the internet, and more people create their own websites, this is a good time to at least start the conversation about digital sustainability.

The Amazon is Now Emitting More Greenhouse Gases Than it is Absorbing l Blogpost

The Amazon is Earth’s largest tropical rainforest with its own self-sustainaing regional climate and hydrological system. It contains a diversity of forests – from montane to mangroves – across a range of distinct soils and substrates, supported by a biogeochemically-diverse riverine network that drives extensive seasonal rainfall. It has been clear for a while that this whole system is under pressure. Unsustainable developing practices – including deforestation for mining, agriculture and dairy farming, as well as illegal logging activities – have all brought it to an ecological tipping point.

Read More

Highest air pollution in Bangladesh, China, India, and Pakistan in 2018

AirVisual and Greenpeace have jointly published the World Air Quality Report for 2018, ranking over 3000 cities based on their pollution levels. Out of the total 64% exceeded the WHO’s annual
exposure guideline for fine particulate matter, also known as PM2.5. In the Middle-East and Africa all (100%) of the measured cities exceeded the WHO guideline. In South Asia and South East Asia this was 99% and 95% respectively, while 89% of cities in East Asia also exceeded the target.

The top 50 cities with the highest average PM2.5 levels during 2018, were from China, India, Bangladesh and Pakistan. At a country level, weighted by population, “Bangladesh is the most polluted country on average, closely followed by Pakistan and India, with Middle Eastern countries, Afghanistan and Mongolia also within the top 10”.

PM2.5 is particulate matter measuring up to 2.5 microns in size. It has the most health impact of all commonly measured air pollutants, has a range of chemical makeups and a variety of sources, such as vehicle engines, industry, wood and coal burning. Because of its small size it can penetrate deep into the respiratory system as well as the entire body.

“Air pollution steals our livelihoods and our futures,” Yeb Sano, executive director of Greenpeace Southeast Asia, said in a statement. “In addition to human lives lost, there’s an estimated global cost of 225 billion dollars in lost labour, and trillions in medical costs,” he added.

Photo credit: AirVisual 


Pollution in the UK

While we have been seeing early onset of spring and and enjoying an unusually warm February, there are some worrying issues at hand too.

On Tuesday, UK residents were warned to restrict outdoor activities because of an increase in pollution in many areas in the country. Our warm weather is due to the air-mass from North Africa, which has also brought Saharan dust. This combined with vehicular and industrial emissions, as well as particles from Europe have all contributed to the increase in countrywide pollution levels.

The Environmental Department, Met Office and the National Weather Service have all warned that the levels will be highest in North England, including in Leeds, Liverpool and Manchester. Meanwhile, air quality in London was close to that of New Delhi, according to the app AirVisual prompting the Mayor’s office to issue alerts. All of these warnings have continued into Wednesday, 27th February, 2019 and is expected to last until Thursday. According to a study by the Royal College of Physicians, approximately 40,000 premature deaths are linked to air pollution.

The increase in pollution levels across the country just goes on to show the failure to bring pollution levels down. While the government has asked 36 of the top polluted cities to submit pollution curbing plans, many have missed the deadlines to do so. Since, 2010, UK’s pollution levels have been high due to nitrogen oxide pollution from diesel vehicles. Bringing it down requires instituting a pollution tax or bringing down the number of diesel vehicles. Effort to do either of these have been very slow due to impacts on local businesses and communities. The government has earmarked an implementation fund of £275m and a £220m clean air fund to minimise local impacts. However, extensive and concrete steps need to be taken immediately to bring down pollution levels, or the country is like to see even more pollution linked deaths and impacts on health.

Photocredit: UK Air - DEFRA


Good news in biodiversity


Fernandina Giant tortoise/ Photocredit AFP

A giant tortoise from the Galapagos, from a species last seen in 1906, has been found. Chelonoidis phantasticus or the Fernandina Giant tortoise was found on Fernandina island and is believed to be a 100 years old female. It is hoped that other individuals of the species will also be found. Genetic testing remains to be done to confirm that it is indeed the same species. The Fernandina Giant tortoise is one of the 15 known species of giant tortoises in the Galapagos. Two of the species are already extinct, one of them being the species (Chelonoidis abingdonii or Pinta Island tortoise) to which Lonesome George, the islands’ most iconic giant tortoise, belonged.

Meanwhile,one the other side of the planet, the world’s largest bee has been spotted in January, for the first time in decades. Wallace’s giant bee, Megachile pluto, which is 4 times larger than the European honeybeewas last seen in the wild in 1981. Alfred Russell Wallace, who came up with the theory of evolution by natural selection around the same time as Darwin, discovered the bee in the 1850s when he lived in the Indonesian islands and made a living by sending back animal species to the UK.

The bee is known to be elusive and was thought to have gone extinct when it was last seen in 1981.

Environment

Climate Change claims its first victim: The Bramble Cay melomys is now extinct

The Bramble Cay melomys was a rodent that lived solely on a tiny sand island in the Torres Strait, near the coast of Papua New Guinea. It has not been seen since 2009 and in 2016 it was described as the first mammalian extinction caused by climate change. Now the Australian government has officially confirmed its eradication. A report by the Australian government has highlighted sea level rise on multiple occasions during the last decade, causing habitat loss and individual mortality, as the reason for the rodent’s extinction.

While this is termed as the first recorded mammalian casualty of human induced climate change, it must also be kept in mind that according to IUCN, Australia has the world’s highest rates of animal extinction.